
*****************************************
Following web services have been terminated.
Real-time Magnetosphere Simulation and SPACE WEATHER SIMULATION (SWS)
The NICT Real-time Space Weather Simulation Service ended at the end of March 2012 because the lease period of the supercomputer for the real-time simulation expired and because a supercomputer for the real-time service will not be immediately available. We plan to develop more accurate and practical space environment models, hoping to be able to resume the real-time simulation in the near future.
*******************************
source http://www.nict.go.jp/en/terminated-web-service.html
Guide On How To View and Understand The NICT Magnetosphere Readings
The nict Magnetosphere Simulation website
http://www2.nict.go.jp/y/y223/simulation/realtime/index.html
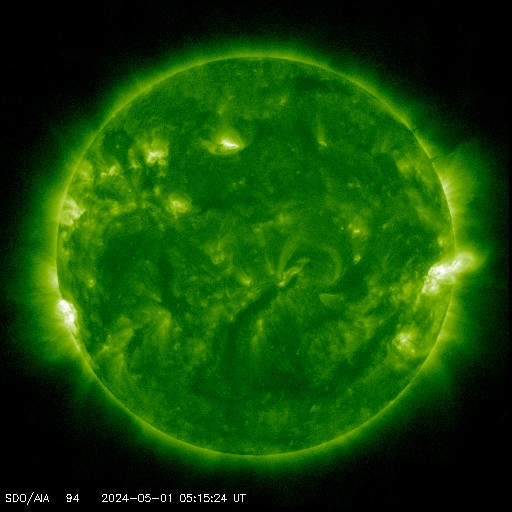
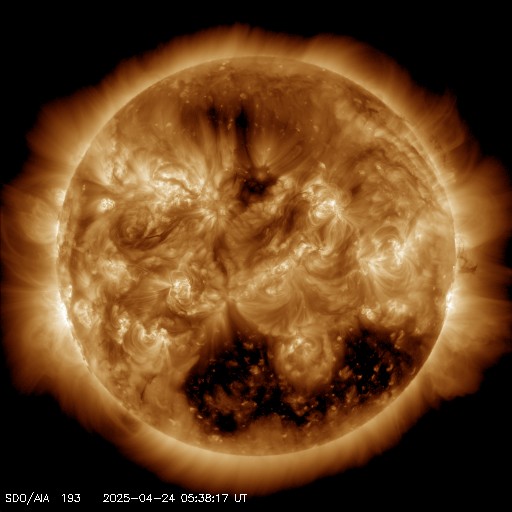
NCIT is a real time Magnetosphere simulation of data gathered from the ACE satellite
if the nict goes down again
YOU CAN SEE ALL ACE DATA HERE:
http://www.solarham.com/ace.htm
http://www.swpc.noaa.gov/ace/ace_rtsw_data.html
ACE is not working properly this week (Feb 6 - Feb 11) and readings are not accurate.
Here is whyhttp://mysolaralerts.blogspot.com/2012/02/ace-tracking-difficulties-feb-6-2012.html
Here is a video explanation of what you are looking at :)
When the Sun produces a Coronal Mass Ejection (CME), the ejection sends solar winds out into space. The solar winds sent out by a CME carry with it it's own magnetic field called the Interplanetary Magnetic Field (IMF) and solar particles (density).
The strength of the CME is what determines how strong the Solar Winds are and the density varies with each CME.
The stronger the CME is, the stronger the solar wind IMF is.
IMPORTANT NOTE:
a Solar Flare and CME are NOT the same.
A Solar Flare is Light, A CME is Mass!
A Flare travels at the speed of light
A CME travels at the speed of ejection
(like pressing on the gas peddle of a car)
A solar Flare is a eruption of intense high-energy radiation from the sun's surface and reaches Earth very fast, in around 8 minutes.
The levels of Flare strength are A, B, C, M and X (in order of weakest to strongest).
http://en.wikipedia.org/wiki/Solar_flare
A CME (coronal mass ejection) is an ejection of material from the solar corona, usually observed with a white-light coronagraph. A CME may or may not be produced by the sunspot explosion. If it does produce a CME, it takes anywhere from 2 to 3 days to reach Earth, and sometimes even longer
http://en.wikipedia.org/wiki/Coronal_mass_ejection
So lets open a new tab in your browser and take a look at this
http://www2.nict.go.jp/y/y223/simulation/realtime/index.html
TOP LEFT PICTURE = The real time simulated picture of of all NICT magnetosphere data. The red and blue lines represent magnetic lines of force found within Earths magnetic field.
When the lines are crossed or in a ball (Example: http://api.ning.com/files/KXDDcbgjz45w5k2FBF1yrj*zWKfxg86ELDPDZMKUe-r3RM-UNEummhSe3qDe2JPlnU*EyA7-dMM-AMn-6YZimocZNlKFLdnc/test_6.20100218065029.jpg?width=721 ), The IMF is in a north direction (positive) and the magnetosphere is protecting its self from solar winds and particles. This is good.
When the lines are open (into wings), the IMF is in a southward direction and the Magnetosphere is open allowing solar wind IMF and particles to connect with Earth's magnetic field (Example: http://i.ytimg.com/vi/V4s2C7pNs3A/0.jpg ).
Top Right Picture = The real time simulated picture of the Pressure on the Magnetosphere (Solar Wind Speed + Density)
When the solar winds and Density is low, the magnetosphere is under little pressure and turns darker blue.
When the solar winds and density is high, the magnetosphere is under high pressure and turns white.
(see scale to the right of simulation)
----------------------------------------------------------
Speed of Solar Winds "V(km/s)" = Energy level
Density "Dens.(p/cc)" = Number of Particles in the Solar Wind
Speed of Solar Winds + Density = Amount of Pressure on our Magnetosphere
= same as
V(km/s) + Dens.(p/cc) = Amount of Pressure on our Magnetosphere
Low Solar Wind Speed = Low amount of Energy
High Solar Wind Speed = High amount of Energy
Low Density = Low amount of Particles
High Density = High amount of Particles
----------------------------------------------------------
Bz(nt) and By(nt):
Bz = North / South
By = East / West
Bz and By measure the angel of the solar wind interplanetary magnetic field (IMF)
Bz and By define a vertical plane like plus sign (+).
The solar wind angle is the angle produced from the vector sum of By and Bz. You can see the solar wind clock angle here along with a more detailed explanation.
http://www.ips.gov.au/Category/Solar/Solar%20Conditions/Solar%20Wind%20Clock%20Angle/Solar%20Wind%20Clock%20Angle.php
Bz being positive (in the green) = A Northward direction of the Solar winds.
This is the same direction as Earths magnetic field.
Because of this, when the SOLAR WIND IMF hit Earths magnetosphere they are repelled back into space.
Bz being Negative (in the red) = A Southward direction of the solar winds.
This is in the opposite direction of Earths magnetic field.
Because of this, when the IMF hits Earths magnetosphere
the two fields connect in a process called Magnetic Reconnection
The more the Bz in the green = the more the northward IMF direction and the stronger the repulsion
The more the Bz is in the red = the more the Southward IMF direction and the stronger the connection
-----------------------------------------------------------
SIMPLE SUMMERY:
When the solar wind speed "V(km/s)" and the density "Dens.(p/cc)" get high, into the green and the Bz(nt) goes south, into the red area, This is when we get a geomagnetic storm.
The more extreme these are into these areas, the more extreme the storm
Photo Example:
http://i.ytimg.com/vi/V4s2C7pNs3A/0.jpg
Magnetosphere Photo with Labels
http://www.nasa.gov/images/content/517890main_Earth-Magnetosphere.jpg
How to read some of the other basic data monitors:
http://www.angelfire.com/geek/solarstormmonitor/
NOAA Space Weather Scale for Geomagnetic Storms:
http://www.swpc.noaa.gov/NOAAscales/
Here is a few good links to keep track of current solar events:
http://solarimg.org/artis/
http://spaceweather.com/
http://solarcycle24.com/
http://prop.hfradio.org/
http://www.swpc.noaa.gov/
http://www.solarmonitor.org/index.php
http://sohowww.nascom.nasa.gov/spaceweather/
http://www.lmsal.com/solarsoft/last_events/
http://www.swpc.noaa.gov/rt_plots/xray_5mBL.html
http://www.swpc.noaa.gov/rt_plots/xray_1m.html
http://www.lmsal.com/hek/her?cmd=home
http://iswa.ccmc.gsfc.nasa.gov:8080/IswaSystemWebApp/
http://hirweb.nict.go.jp/sedoss/solact3
http://www.swpc.noaa.gov/drap/Global.png
http://www.gdgps.net/products/images/tec-map-br.jpg
http://www.swpc.noaa.gov/pmap/
http://stereo.ssl.berkeley.edu/multistatus.php
http://sidc.oma.be/LatestSWData/LatestSWData.php
http://helioviewer.org/
This is a basic guide that we tried to keep simple to understand.
Of course this gets much more complicated and there are many events in space that effect Earth.
If you wish to learn more, doing a simple search will turn out a wealth of information.
some good links provided may assist visuals if you have not read before
Solar Magnetic Polarity Reversal
http://www.thunderbolts.info/tpod/2009/arch09/090909polarity.htm
Our Misunderstood Sun
http://www.holoscience.com/news.php?article=ah63dzac
Following web services have been terminated.
Real-time Magnetosphere Simulation and SPACE WEATHER SIMULATION (SWS)
The NICT Real-time Space Weather Simulation Service ended at the end of March 2012 because the lease period of the supercomputer for the real-time simulation expired and because a supercomputer for the real-time service will not be immediately available. We plan to develop more accurate and practical space environment models, hoping to be able to resume the real-time simulation in the near future.
*******************************
source http://www.nict.go.jp/en/terminated-web-service.html
Guide On How To View and Understand The NICT Magnetosphere Readings
The nict Magnetosphere Simulation website
http://www2.nict.go.jp/y/y223/simulation/realtime/index.html
NCIT is a real time Magnetosphere simulation of data gathered from the ACE satellite
if the nict goes down again
YOU CAN SEE ALL ACE DATA HERE:
http://www.solarham.com/ace.htm
http://www.swpc.noaa.gov/ace/ace_rtsw_data.html
ACE is not working properly this week (Feb 6 - Feb 11) and readings are not accurate.
Here is whyhttp://mysolaralerts.blogspot.com/2012/02/ace-tracking-difficulties-feb-6-2012.html
Here is a video explanation of what you are looking at :)
When the Sun produces a Coronal Mass Ejection (CME), the ejection sends solar winds out into space. The solar winds sent out by a CME carry with it it's own magnetic field called the Interplanetary Magnetic Field (IMF) and solar particles (density).
The strength of the CME is what determines how strong the Solar Winds are and the density varies with each CME.
The stronger the CME is, the stronger the solar wind IMF is.
If a CME is Earth directed, it then sends those Solar Winds and IMF in Earths direction. The IMF is not constant and changes in strength and polarity (north/south) orientation.
This simulation shows the effects of Solar Flares and CME's on Earths Magnetosphere in real time.
(Note: Earth facing magnetic filament eruptions and coronol hole's also effect Earths magnetosphere. Do a search to learn more about these events)
This simulation shows the effects of Solar Flares and CME's on Earths Magnetosphere in real time.
(Note: Earth facing magnetic filament eruptions and coronol hole's also effect Earths magnetosphere. Do a search to learn more about these events)
IMPORTANT NOTE:
a Solar Flare and CME are NOT the same.
A Solar Flare is Light, A CME is Mass!
A Flare travels at the speed of light
A CME travels at the speed of ejection
(like pressing on the gas peddle of a car)
A solar Flare is a eruption of intense high-energy radiation from the sun's surface and reaches Earth very fast, in around 8 minutes.
The levels of Flare strength are A, B, C, M and X (in order of weakest to strongest).
http://en.wikipedia.org/wiki/Solar_flare
A CME (coronal mass ejection) is an ejection of material from the solar corona, usually observed with a white-light coronagraph. A CME may or may not be produced by the sunspot explosion. If it does produce a CME, it takes anywhere from 2 to 3 days to reach Earth, and sometimes even longer
http://en.wikipedia.org/wiki/Coronal_mass_ejection
So lets open a new tab in your browser and take a look at this
http://www2.nict.go.jp/y/y223/simulation/realtime/index.html
TOP LEFT PICTURE = The real time simulated picture of of all NICT magnetosphere data. The red and blue lines represent magnetic lines of force found within Earths magnetic field.
When the lines are crossed or in a ball (Example: http://api.ning.com/files/KXDDcbgjz45w5k2FBF1yrj*zWKfxg86ELDPDZMKUe-r3RM-UNEummhSe3qDe2JPlnU*EyA7-dMM-AMn-6YZimocZNlKFLdnc/test_6.20100218065029.jpg?width=721 ), The IMF is in a north direction (positive) and the magnetosphere is protecting its self from solar winds and particles. This is good.
When the lines are open (into wings), the IMF is in a southward direction and the Magnetosphere is open allowing solar wind IMF and particles to connect with Earth's magnetic field (Example: http://i.ytimg.com/vi/V4s2C7pNs3A/0.jpg ).
Top Right Picture = The real time simulated picture of the Pressure on the Magnetosphere (Solar Wind Speed + Density)
When the solar winds and Density is low, the magnetosphere is under little pressure and turns darker blue.
When the solar winds and density is high, the magnetosphere is under high pressure and turns white.
(see scale to the right of simulation)
----------------------------------------------------------
Speed of Solar Winds "V(km/s)" = Energy level
Density "Dens.(p/cc)" = Number of Particles in the Solar Wind
Speed of Solar Winds + Density = Amount of Pressure on our Magnetosphere
= same as
V(km/s) + Dens.(p/cc) = Amount of Pressure on our Magnetosphere
Low Solar Wind Speed = Low amount of Energy
High Solar Wind Speed = High amount of Energy
Low Density = Low amount of Particles
High Density = High amount of Particles
----------------------------------------------------------
Bz(nt) and By(nt):
Bz = North / South
By = East / West
Bz and By measure the angel of the solar wind interplanetary magnetic field (IMF)
Bz and By define a vertical plane like plus sign (+).
The solar wind angle is the angle produced from the vector sum of By and Bz. You can see the solar wind clock angle here along with a more detailed explanation.
http://www.ips.gov.au/Category/Solar/Solar%20Conditions/Solar%20Wind%20Clock%20Angle/Solar%20Wind%20Clock%20Angle.php
Bz being positive (in the green) = A Northward direction of the Solar winds.
This is the same direction as Earths magnetic field.
Because of this, when the SOLAR WIND IMF hit Earths magnetosphere they are repelled back into space.
Bz being Negative (in the red) = A Southward direction of the solar winds.
This is in the opposite direction of Earths magnetic field.
Because of this, when the IMF hits Earths magnetosphere
the two fields connect in a process called Magnetic Reconnection
The more the Bz in the green = the more the northward IMF direction and the stronger the repulsion
The more the Bz is in the red = the more the Southward IMF direction and the stronger the connection
-----------------------------------------------------------
SIMPLE SUMMERY:
When the solar wind speed "V(km/s)" and the density "Dens.(p/cc)" get high, into the green and the Bz(nt) goes south, into the red area, This is when we get a geomagnetic storm.
The more extreme these are into these areas, the more extreme the storm
Photo Example:
http://i.ytimg.com/vi/V4s2C7pNs3A/0.jpg
Magnetosphere Photo with Labels
http://www.nasa.gov/images/content/517890main_Earth-Magnetosphere.jpg
How to read some of the other basic data monitors:
http://www.angelfire.com/geek/solarstormmonitor/
NOAA Space Weather Scale for Geomagnetic Storms:
http://www.swpc.noaa.gov/NOAAscales/
Here is a few good links to keep track of current solar events:
http://solarimg.org/artis/
http://spaceweather.com/
http://solarcycle24.com/
http://prop.hfradio.org/
http://www.swpc.noaa.gov/
http://www.solarmonitor.org/index.php
http://sohowww.nascom.nasa.gov/spaceweather/
http://www.lmsal.com/solarsoft/last_events/
http://www.swpc.noaa.gov/rt_plots/xray_5mBL.html
http://www.swpc.noaa.gov/rt_plots/xray_1m.html
http://www.lmsal.com/hek/her?cmd=home
http://iswa.ccmc.gsfc.nasa.gov:8080/IswaSystemWebApp/
http://hirweb.nict.go.jp/sedoss/solact3
http://www.swpc.noaa.gov/drap/Global.png
http://www.gdgps.net/products/images/tec-map-br.jpg
http://www.swpc.noaa.gov/pmap/
http://stereo.ssl.berkeley.edu/multistatus.php
http://sidc.oma.be/LatestSWData/LatestSWData.php
http://helioviewer.org/
This is a basic guide that we tried to keep simple to understand.
Of course this gets much more complicated and there are many events in space that effect Earth.
If you wish to learn more, doing a simple search will turn out a wealth of information.
some good links provided may assist visuals if you have not read before
Solar Magnetic Polarity Reversal
http://www.thunderbolts.info/tpod/2009/arch09/090909polarity.htm
Our Misunderstood Sun
http://www.holoscience.com/news.php?article=ah63dzac
goyard
ReplyDeletegolden goose
goyard tote
golden goose outlet
supreme
moncler outlet
adidas yeezy
moncler jackets
goyard bags
golden goose sneakers
moncler
xiaofang20191202
golden goose outlet
ReplyDeletebape hoodie
golden goose sneakers
jordan shoes
kyrie 5 spongebob
supreme t shirt
air jordans
golden goose sneakers
moncler jacket
moncler outlet